| Problem | 971 promotions planned on gut feel. Volume went up, but nobody knew if they made money, and deep promos kept running out of stock. |
| My role | Product manager, data engineer and analyst: discovery, PRD, star schema and quality gate, SQL, Python models (elasticity, forecasting, A/B test), simulator, Excel model. |
| Tools | Python (pandas, NumPy, SciPy, matplotlib) · SQL (window functions, CTEs) · Star schema · JavaScript · Excel |
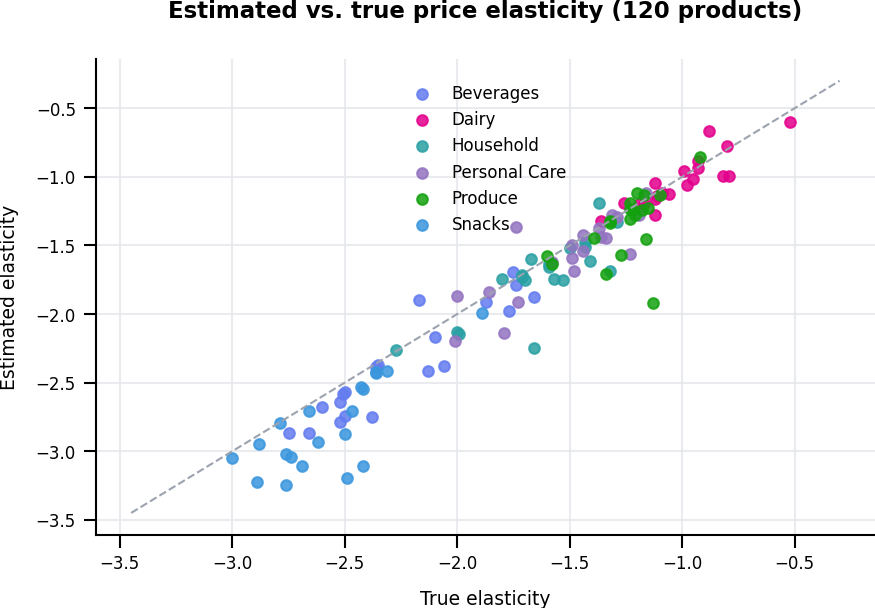
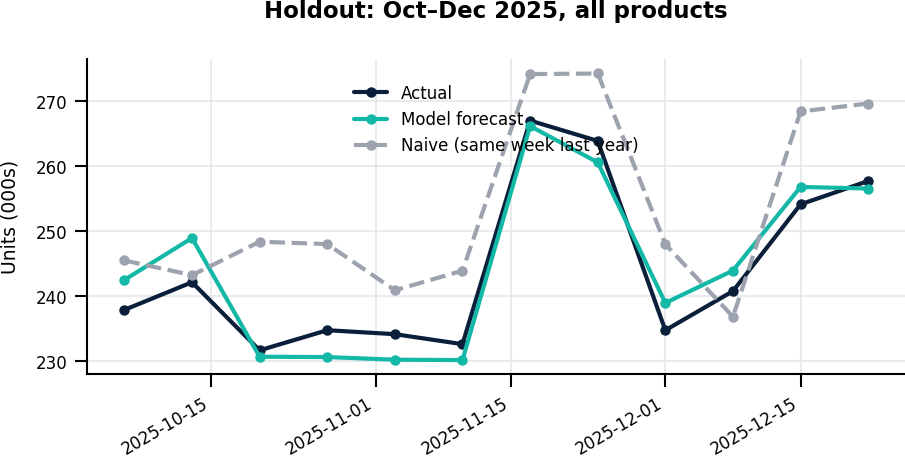
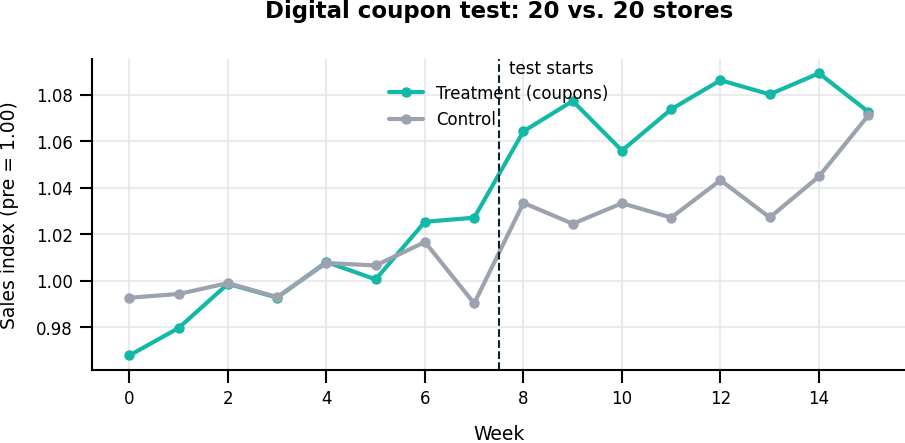
| Impact | Found that only 33% of promos paid back (net −$454K); price model recovers true elasticities with r = 0.97; promo-week forecast error cut from 44% to 14%; coupon A/B test stopped a rollout that grew sales but not profit. |
- 1. The problem
- 2. Users & discovery
- 3. Thought process
- 4. PRD
- 5. Data engineering
- 6. SQL
- 7. Python analysis
- 8. Live MVP
- 9. Financial impact
- 10. Challenges
- 11. Results & next
Promotions that grow volume and shrink profit
FreshCart is a 40-store grocery chain. Category managers run promotions every week and are judged on unit sales. Three things were going wrong:
- Promo profit was invisible. Lift was measured in units. Nobody counted the discount cost, the sales stolen from the sibling brand, or the dip the following week.
- Promos ran out of stock. Every promo was planned with the same flat 2x inventory rule. Promo weeks stocked out 14% of the time vs. 0.1% for regular weeks.
- Price changes were guesses. FY2025 price increases lifted gross margin 4.7% while units fell 5.8%, but nobody could say which products could take an increase.
| Persona | Job to be done | What they told us |
|---|---|---|
| Category Manager | Decide which promos to repeat or stop | "My bonus is on units, so I go deep on discounts." |
| Pricing Analyst | Set regular prices | "Every category gets the same 3% increase." |
| Supply Chain Planner | Order stock for promo weeks | "We know 2x is wrong, but what else do we use?" |
| FP&A (supporting) | Explain margin and promo ROI | "I can't split price from volume from mix." |
Key insights (simulated interviews)
- The scorecard drives the behavior. Measuring units rewards deep discounts, so the fix starts with the metric.
- Shoppers swap, they don't add. When the National brand is on sale, the FreshCart version of the same item sells less.
- Planners need a number, not a model. Output must be a recommended order quantity per promo.
Approaches I compared
| Approach | Accuracy | Explainable | Decision |
|---|---|---|---|
| Same discount rules for every product | Low | Yes | ✗ ignores very different price sensitivity |
| SQL baseline: average of prior 4 weeks | Medium | Yes | Keep for quick checks (Query 4) |
| Regression per product with promo, seasonality, sibling and post-promo controls | High | Yes | ✓ MVP |
| Machine-learning demand model | Possibly higher | Harder | V2, once trust is built |
Key decision: explainability over a few points of accuracy. Category managers have to defend a "stop this promo" call to their leadership, so every number traces back to an elasticity they can see.
What to build first (RICE)
| Feature | Reach | Impact | Confidence | Effort | RICE | Decision |
|---|---|---|---|---|---|---|
| Promo scorecard (net margin per promo) | 30 | 3 | 90% | 2 | 40.5 | MVP |
| Price & promo simulator | 30 | 3 | 80% | 3 | 24 | MVP |
| Promo demand forecast & stock check | 15 | 2 | 80% | 2 | 12 | MVP |
| Competitor price tracking | 30 | 2 | 50% | 5 | 6 | V2 |
| Automated price changes | 30 | 3 | 30% | 6 | 4.5 | Not doing |
Reach = users per quarter; Impact on a 1–3 scale; Effort in person-months.
PRD summary
- Goal: turn net promo margin from −$454K to break-even or better within two planning cycles.
- Must-haves: simulator with net-margin waterfall, Repeat/Fix/Stop scorecard, elasticity with uncertainty, stock check for upcoming promos.
- Success metrics: share of promos that pay back (33% → 50%), promo-week stockouts (14% → ≤ 5%), promo forecast error ≤ 15%.
- Out of scope: automated price changes, competitor prices, personalized pricing.
Star schema
Four raw extracts become one fact table at product × region × week grain (49,920 rows over 104 weeks) with four dimensions.
list_price · price_paid
units_sold · inventory_units · stockout_flag
revenue · cogs · gross_margin · discount_amount
Download the data: fact_sales_weekly · dim_product · dim_promo · dim_region · ab_test
The SQL behind the analysis
All 7 queries ran on the RetailPulse dataset; results are actual outputs. Skills shown: DDL, data validation, CTEs, self-joins, window functions (rolling AVG, cumulative SUM), conditional aggregation.
Staging turns four raw extracts into a star schema: one sales fact table at product × region × week grain, plus product, region, promo and date dimensions.
CREATE TABLE dim_date AS
SELECT DISTINCT
    week_start                                    AS date_key,
    CAST(STRFTIME('%Y', week_start) AS INTEGER)   AS year,
    CAST(STRFTIME('%W', week_start) AS INTEGER)   AS week_of_year,
    (CAST(STRFTIME('%m', week_start) AS INTEGER) + 2) / 3 AS quarter
FROM raw_fact_sales_weekly;

CREATE TABLE fct_sales AS
SELECT
    f.week_start                       AS date_key,
    f.product_id, f.region_id, f.promo_id,
    f.list_price, f.price_paid,
    f.units_sold, f.inventory_units, f.stockout_flag,
    f.revenue, f.cogs,
    f.revenue - f.cogs                 AS gross_margin,
    (f.list_price - f.price_paid) * f.units_sold AS discount_amount
FROM raw_fact_sales_weekly f;
| table_name | row_count |
|---|---|
| fct_sales | 49,920 |
| dim_product | 120 |
| dim_region | 4 |
| dim_promo | 971 |
| dim_date | 104 |
Modeling, validation, forecasting and experimentation
9 steps, all run on the dataset. Outputs and charts below are real. Download the notebook to run it yourself.
Join the fact table to its dimensions and confirm the scale of the stockout problem.
import pandas as pd, numpy as np
import matplotlib.pyplot as plt
from scipy import stats

fact   = pd.read_csv("data/fact_sales_weekly.csv", parse_dates=["week_start"])
prod   = pd.read_csv("data/dim_product.csv")
region = pd.read_csv("data/dim_region.csv")
promo  = pd.read_csv("data/dim_promo.csv", parse_dates=["week_start"])

df = (fact.merge(prod, on="product_id")
          .merge(region, on="region_id")
          .merge(promo[["promo_id", "discount_pct", "promo_type", "vendor_funding_pct"]], on="promo_id", how="left"))
df["week_idx"] = ((df.week_start - df.week_start.min()).dt.days // 7).astype(int)
df["woy"]      = df.week_idx % 52
df["on_promo"] = df.promo_id.notna().astype(int)
# net unit cost after vendor funding (national-brand promos are 50% supplier-funded)
df["net_unit_cost"] = np.where(df.units_sold > 0, df.cogs / df.units_sold.clip(lower=1), df.unit_cost)

print(f"{len(df):,} rows | {df.product_id.nunique()} products | "
      f"{df.region_id.nunique()} regions | {df.week_idx.nunique()} weeks")
print(f"Revenue ${df.revenue.sum()/1e6:,.1f}M | promo weeks stocked out: "
      f"{df.loc[df.on_promo==1,'stockout_flag'].mean():.0%} vs "
      f"{df.loc[df.on_promo==0,'stockout_flag'].mean():.1%} on regular weeks")
Try it: simulate a promo, review the scorecard, check stock
Start with Snacks → Potato Chips at 20% off, then switch the inventory plan to "Order to forecast". Then try a 30% discount on any Dairy product.
Why margin grew while revenue fell
| Step | Gross margin | What it means |
|---|---|---|
| FY2024 gross margin | $28.84M | 33.5% of revenue |
| Volume effect | −$1.68M | 5.8% fewer units |
| Mix effect | +$0.01M | Little shift between high- and low-margin items |
| Rate effect (price & cost) | +$3.03M | Price increases and per-unit changes |
| FY2025 gross margin | $30.21M | 36.0% of revenue (+4.7%) |
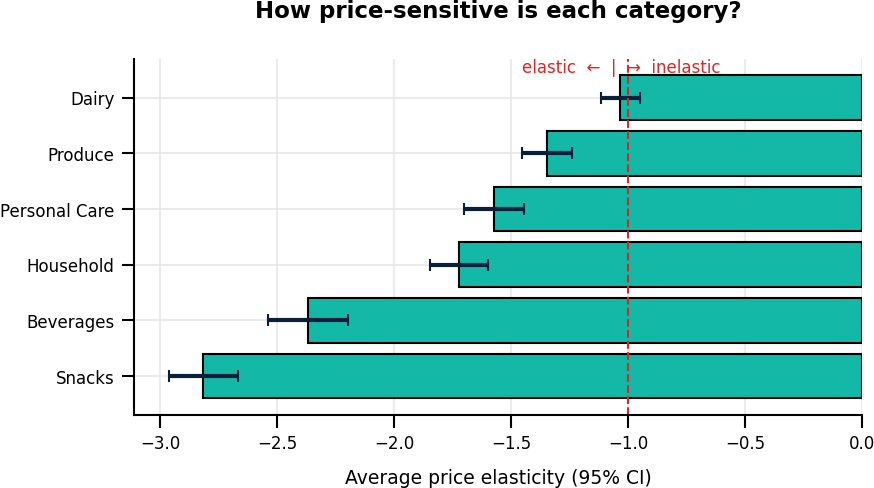
Revenue fell 2.4%, but margin rose 4.7%. Price increases more than paid for the lost volume overall. The elasticity model shows where this works (dairy, produce) and where it doesn't (snacks, beverages).
Promo economics
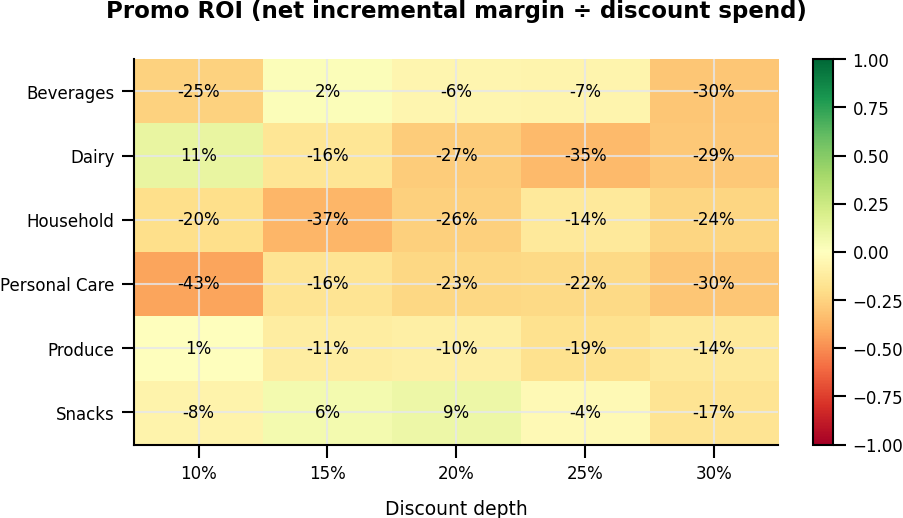
The promo program generated +$1.10M gross incremental margin, but cannibalization and pull-forward turned that into −$454K net on $3.21M of FreshCart-funded discounts. Snacks was the only category with positive net promo margin (+$44K).
Download the Excel modelIncludes a promo ROI calculator that matches the simulator to the dollar, a discount × vendor-funding sensitivity table, and the margin bridge built with formulas from product-level data.
| Challenge | How I solved it |
|---|---|
| First model failed: elasticity estimates correlated only 0.33 with the truth | Diagnosed it: prices barely changed outside promos, so price and promo effects were tangled. Regional price zones and quarterly price reviews added real price variation. Correlation rose to 0.97. |
| First scorecard said 75% of promos should stop | The data ignored vendor funding, which pays for much of a national-brand discount in real grocery. Adding it gave a realistic picture: 33% repeat, 46% fix, 21% stop. |
| Stockouts hide true demand | Excluded stockout weeks from model fitting, then estimated lost sales separately (132K units). |
| Promo lift looked bigger than it was | Added sibling-promo and post-promo features, so cannibalization and pull-forward are measured, not ignored. |
| Excel and the simulator disagreed by $665 | Excel assumed the sibling's margin equaled the promoted product's. Added the real sibling margin; both now show $614. |
| The model "wants" big price increases on inelastic items | Added a price-image caveat and a +5–8% cap recommendation; large changes must be A/B tested first. |
| Confidence intervals cover the truth only 82% of the time, not 95% | Reported it openly. Likely causes: cross-category cannibalization the model doesn't capture, and stockout censoring. Queued for V2. |
Recommendations
Score category managers on net promo margin, not units. Cap dairy and produce discounts at 10–15%; stop deep discounts on inelastic items.
Don't roll out the digital coupon program as tested: sales +3.8% but margin flat. Redesign toward private-label and higher-margin items, then re-test.
Replace the flat 2x rule with forecast-based orders. 3 of the next 22 promos are already at high stockout risk.
What I'd do next
- Ask RetailPulse: natural-language questions on this data, using the AskData pattern.
- Vendor negotiation view: show each supplier how much funding a promo needs to break even.
- Competitor prices and an ML demand model, compared against this baseline on the same holdout.
- Fix CI coverage by modeling cross-category cannibalization.